15. April 2024 By Dr. Patrick Kübler
Why our customers start with product cons reporting when it comes to IIoT
Every day, our customers experience that employees have to create reports manually. They have to collate data from various systems and from many contact persons in the company. The key figures are then checked, revised and approved in several loops by different parties.
Negative effects of manual reporting
The manual reporting process causes high personnel costs.
Well-trained employees are unable to use their skills to optimise processes and are trapped in highly repetitive tasks.
It is becoming increasingly difficult to find employees who are willing to take on these tasks.
The key figures generated are never up-to-date and do not enable targeted production control.
Reports often go through several revision loops to take political aspects into account, which reduces the quality of the key figures.
Due to the repetitive nature of the work, there are often errors in data collection and the calculation of key figures, which further reduces the quality of the key figures.
High importance of reporting
All of this is in stark contrast to the importance of key figures for managers, as production has always been strongly driven by efficiency and therefore key figures. In most cases, the remuneration of managers depends on the achievement of predefined targets - such as the reduction of manufacturing costs, the reduction of scrap costs, the increase in delivery reliability or the increase in plant availability. The interest in meaningful and high-quality key figures is therefore consistently high.
Why our customers are starting to automate their reporting
We are seeing a strong increase in the importance of IIoT and the digitalisation of production for our customers. No company today can afford not to be active in this area. But why are many companies starting with reporting of all things?
In addition to the aforementioned importance of reporting, there are the following reasons:
- Reports have a high level of attention at management level and form the basis for important company decisions, including investments in digitalisation.
- From a technical perspective, the reporting of key figures is comparatively simple, as there are no real-time requirements and there is no need to intervene directly in ongoing processes.
- The business case is easier to calculate, as the manual effort that is usually eliminated by reporting is easy to estimate.
What is so special about production?
Most of our customers already have automated reporting in other departments. In contrast to production, however, the data there is centralised in a leading IT system. The situation is completely different in production. It is not uncommon for dozens of shop floor applications to be in use in one plant alone. The data is distributed accordingly in different systems. In some cases, the data first has to be collected from the machine control systems. This means that the effort is less about visualising key figures and more about automated data collection through the integration of different production software systems.

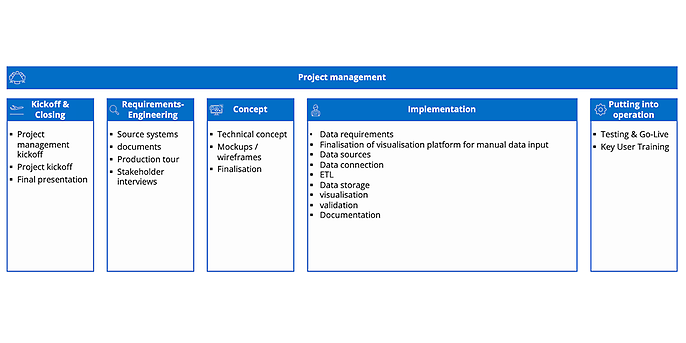
Figure 1: The project procedure for production reporting at adesso
How do we proceed in the project?
Figure 1 summarises our project approach in this context. At the start of the project, we go into production and gain an initial overview. To avoid reinventing the wheel, we analyse existing (usually Excel-based) control solutions and record the data source systems. Close involvement of the various stakeholders is important in this phase. Based on these analyses, we create a technical concept and visualise it as early as possible in the project with the help of mockups or wireframes. These graphical representations make it easier for us to discuss with the stakeholders and help to finalise the technical concept in a workshop. This is followed by the most time-consuming part of the project: the development of interfaces to the source systems in order to access the relevant data. The actual implementation is followed by commissioning, including training the key users.
What are the key success factors for implementation?
Our experience shows that reporting projects should not be viewed in purely technical terms. After all, reporting and key figures are often emotionally charged topics, as they have a direct impact on managers' salaries. That's why we support our customers not only with the technical realisation but also with the functional design of the reporting and with the introduction as part of professional change management.
At the start of the project, we provide a standard KPI system and a dashboard based on best practices from other customer contexts. In most cases, we customise the template to the company's objectives and the specific production system during the course of the project. It is important to calculate the key figures in a standardised way across all sites and to identify the relevant source systems for data procurement. Mock-ups are developed early on in the project to ensure user-friendliness and gain the commitment of all those involved. In some cases, it makes sense to provide production with a dashboard that can initially be filled with data manually or via an Excel import. In this way, those responsible have something in their hands at an early stage and can see the added value of the project. It is important that these dashboards can also be used later in the automated environment so as not to generate unnecessary additional work.
Which technologies do we use in the projects?
As most of our customers start with the automation of reporting in other departments, BI solutions are often already in use. Typical technologies include SAP BW or Snowflake as a data warehouse and PowerBI, SAP SAC or Tableau as a BI solution. To avoid creating another silo and further increasing the complexity for IT management, the technologies already in use should also be utilised in production.
We encounter a very high degree of heterogeneity, especially in the source systems. In our projects, we see different MES systems such as MPDV Hydra, SAP DM, Felios or Critical Manufacturing MES. The closer you get to the field level, the more heterogeneous the systems become - especially in an international context. While we often deal with Siemens control systems in Germany, we may be working with Rockwell control systems at the same customer's American plants, for example. Another driver of complexity is the different age of the control systems used.
But it's not just the hardware used that is diverse; we also have to deal with very heterogeneous data models for the systems time and again. It is not uncommon for a separate solution to be developed for each system. Here we recommend that our customers standardise "as close as possible" to the machine and not try to solve the problem in higher-level software systems. This means that a standardised data model for similar systems must be defined and implemented at the start of the project so that the data can be processed in the higher-level IT systems.
What do our customers value?
It is important to our customers that the solutions are scalable, that the key figures are calculated uniformly and that the dashboards display different information content depending on the company level. After all, a shift manager needs different information than a board member in order to be able to carry out their tasks efficiently. Many customers want to be able to customise the dashboards themselves. Authorisation concepts ensure that not everyone can see everything and that the displays can only be adapted by authorised employees. In order to be able to use the data obtained for other digitalisation use cases, it is important not to create separate data silos, but to bring the data together on a central platform.
Nothing works without data quality!
As always with digitalisation, data quality plays a central role in the informative value of the key figures. Responsibility for data quality must lie with the specialist department. We have had the best experiences when responsibility has been clearly defined and a data steward has been appointed in the department.
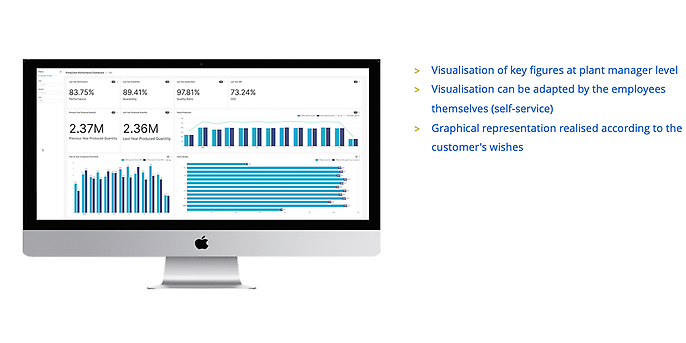
Figure 2 shows an example of a dashboard from the perspective of a plant manager that we developed for a customer.

Figure 2: Example of a realisation
Further advantages of production reporting for our customers
The automatically generated key figures create transparency about the current status of production, which makes it easier to identify areas for action and thus to make targeted investments in digitalisation projects. Up-to-date key figures make it easier to assess the economic added value of many digitalisation projects in production. The dashboards also create visibility for the topic of digitalisation among managers and employees, which increases the willingness for further projects.
What happens next?
Data models and architectures are already being developed as part of the reporting project in order to be able to process data from field level to company management level. In other words, exactly what is meant by the buzzword "IIoT". We therefore recommend that our customers anticipate the next steps on the digitalisation roadmap as early as the reporting project and develop corresponding concepts and architectures to support further expansion.
You can find more exciting topics from the world of adesso in our previous blog posts.

