20. July 2021 By Philipp Klüber and Angelika Bogacka
Evaluating innovative self-service analytics tools – data democratisation on a new path
Project procedure
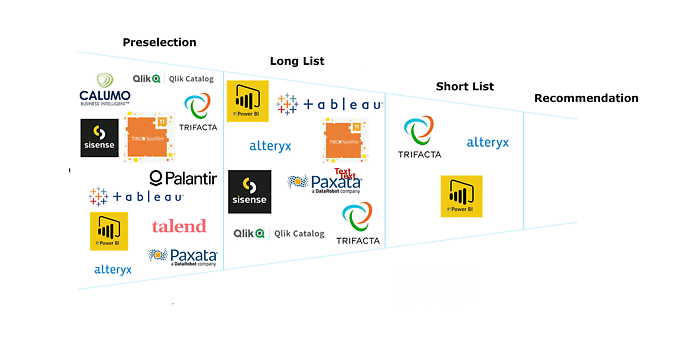
The evaluation started with clarifying the initial situation and collecting requirements based on experience with the tool used up to now. This then served as the basis for the subsequent market screening. An initial evaluation of the providers was carried out, and a first preselection was made. The vendors were examined more closely, assessed with regard to their KO criteria and transferred to a long list. The long list was then reduced to a short list taking into account essential requirements, exclusion criteria and other customer-specific factors. The following figure provides an overview of the selection carried out in the evaluation.

Vendor selection
After the shortlist was established, the tools were compared in detail. For this purpose, a catalogue of criteria was defined on the basis of the requirements. This included weighting of the various requirements. The catalogue, which included approximately 100 criteria, was then used to evaluate the candidates on the shortlist.
In order to be able to better evaluate the practice-relevant criteria from the catalogue, representative use cases were selected and technically tested together with the stakeholders within the framework of a proof of technology process. This made it possible to gain subjective impressions in addition to the objective and practical insights. We would like to share these impressions with you in the following.
Introducing Alteryx | highlights and lowlights
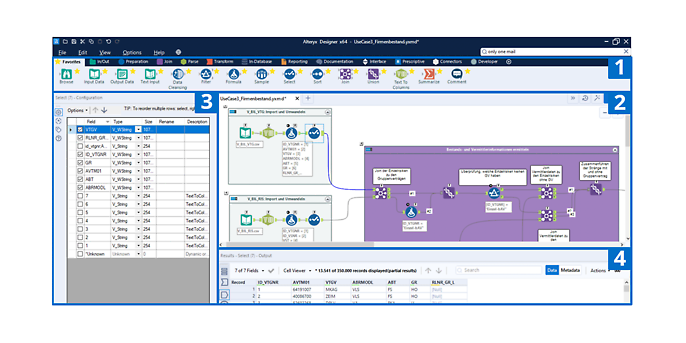
Alteryx’s software product consists of two components – the server version and the client installation. The server version can be used for scheduling workflows, and it enables versioned joint editing. The client installation allows users to develop workflows locally and includes the same range of functions as the server version, except for collaboration and scheduling components. A toolbar organised by function groups can be found in the upper part of the tool interface (1). The individual tools from the bar can be dragged and dropped onto the graphical representation of the processing steps in the centre (2). When one of the tools is selected, the possible settings are shown in the left window (3). The incoming and outgoing data streams (4) can be viewed in the lower part of the window, allowing simple control of the tool configuration.

Alteryx tool surface
One highlight worth mentioning is Alteryx’s search function. In addition to tools and manufacturer help, it also includes entries from the community. With over 341,000 posts, more than 188,000 likes and almost 24,000 solutions, this is an extremely positive aspect that deserves to be mentioned. Thanks to this impressive level of activity, the Alteryx community also won the Community Industry Award this year, presented by CMX. Alteryx also offers the option to cache intermediate results. This is especially helpful during development, as it can significantly speed up the process of running through workflows. In addition, individual containers can also be switched on and off in the workflow.
On the other hand, the German translation of the tool does not always impress. For example, the intended word ‘Tabulator’ is translated as ‘Registerkarte’ in the tool. However, the English setting can be used without any problems as the terminology of the data preparation environment is usually familiar to users and may therefore the better option for some. The Visual Query connection/database connection is sometimes very slow and therefore interferes with processing. We found this to be another negative aspect.
Introducing Trifacta | highlights and lowlights
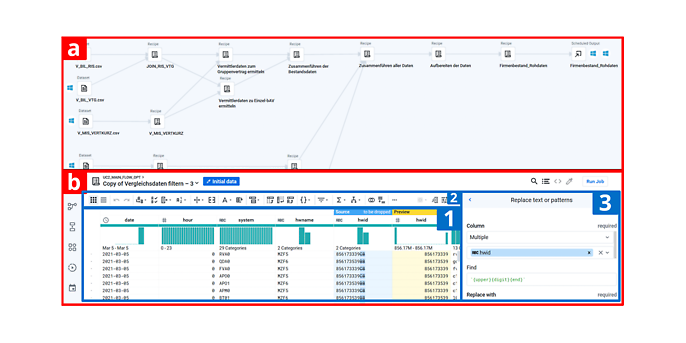
Trifacta is a purely cloud-based software solution. After central installation, users can access the tool via the browser. Scaling is easy and convenient thanks to the modern architecture of the cloud solution. There are two main views in the tool, the graphical overview (a) and the editing view (b). The graphical overview shows the entire workflow, allowing the relationships between the inputs, outputs and individual recipes (groups of transformation steps) to be understood. The editing view shows the individual adjustments within a recipe. For this purpose, the table content is moved to the centre of the view (1). As with Alteryx, a toolbar is available in this view (2). In addition, the definition or display of all individual steps can be seen (3).

Trifacta tool surface
A particular highlight of Trifacta are the suggestions for transformations. Content can be marked in the tables, after which the tool makes suggestions for possible and useful transformations based on integrated machine learning models. Changes are generally displayed in a preview, allowing for easy tracking. In addition, Trifacta is also able to automatically recognise data formats. When combined, the tool can therefore also make suggestions on how to change the data, for example, to introduce a uniform data format.
One disadvantage is the structure of the tool. Switching between the two views presented makes it difficult to maintain an overview in large workflows. In addition, switching views takes a relatively long time, making processing tedious. This lack of clarity also continues in the lack of an option to structure the files and workflows using folders. Furthermore, the window for entering formulas cannot be enlarged or formatted. Even though it gets bigger as entries are made, it is still not suitable for complex formulas due to a lack of formatting and graphical presentation. When it comes to formulas, the software also uses a syntax that we found somewhat unusual. The result is that expressions cannot be extended as required. For example, only two expressions are possible for the ‘OR’ operator, which means that further OR expressions can only be represented by linking several ‘OR’ formulas.
Introducing Microsoft Power BI Dataflows | highlights and lowlights
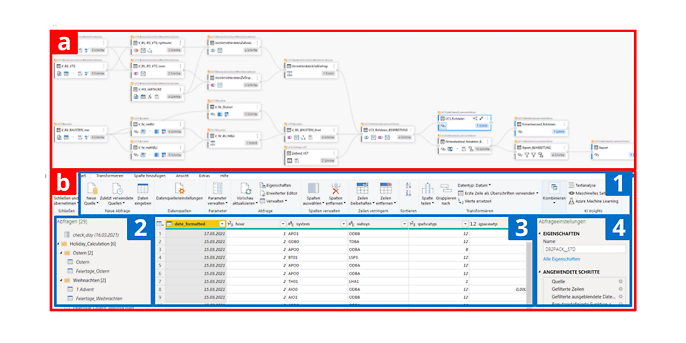
Similar to Alteryx, Microsoft Power BI Dataflows has two components. There is an online version and a local component. For example, scheduling can be carried out in the online version. A graphical overview of the data flow can also be displayed here. The local component of the tool offers the same range of functions as the online version, but has some minor limitations. Similar to Trifacta, the tool has two main views – the graphical, clear representation of the entire transformation process (a) and an editing view (b). The editing view contains a toolbar (1) with various tabs, whose structure resembles other familiar Microsoft applications. The various intermediate results can be structured using folders (2). Individual tables can also be selected at this point. The table content is shown in the centre (3), and the applied transformation steps are displayed on the right (4).

Microsoft Power BI Dataflows tool surface
Microsoft Power BI Dataflows has the advantage that the interface is designed similarly to other Microsoft applications and is therefore intuitive to use. Since Dataflows is a part of Power BI, very extensive visualisation options are available compared to the other tools evaluated.
On the other hand, the range of functions offered by the standard tools of Dataflows is severely limited. Accordingly, more complex transformations must be programmed by the user. In general, we found programming in Dataflows to be somewhat awkward, as each step must be referenced to a previous step. In addition, structuring in Dataflows can only be implemented via folders when used locally. This makes it difficult to set up larger workflows and significantly restricts clarity.
Summary
We recommend the tool from Alteryx for data preparation as it optimally fulfils the requirements. It is a sophisticated tool that is well suited for data democratisation in the self-service sector. Important requirements (for example, reusability or programming options) are met and rounded off with good documentation and a thriving community.
In comparison, Trifacta is less mature, which is demonstrated, for example, by the lack of structuring options for workflows and files as well as the insufficient syntax error messages. The key advantages are the modern architectural design as a scalable web application as well as the interactive work with data (suggestions for transformations).
Power BI Dataflows is not recommended for the purpose under investigation as it is not a full-featured data preparation tool. As a data processing tool (of pre-processed data) designed to supply Power BI reports, Dataflows is unable to fulfil essential requirements such as exporting files. The range of functions offered by the standard tools is also limited for the reason stated.
Would you like to learn more about exciting topics from the world of adesso? Then check out our latest blog posts.


